Data Visualization Course | Data Visualization Tutorial | Data Visualization Explained
About Course
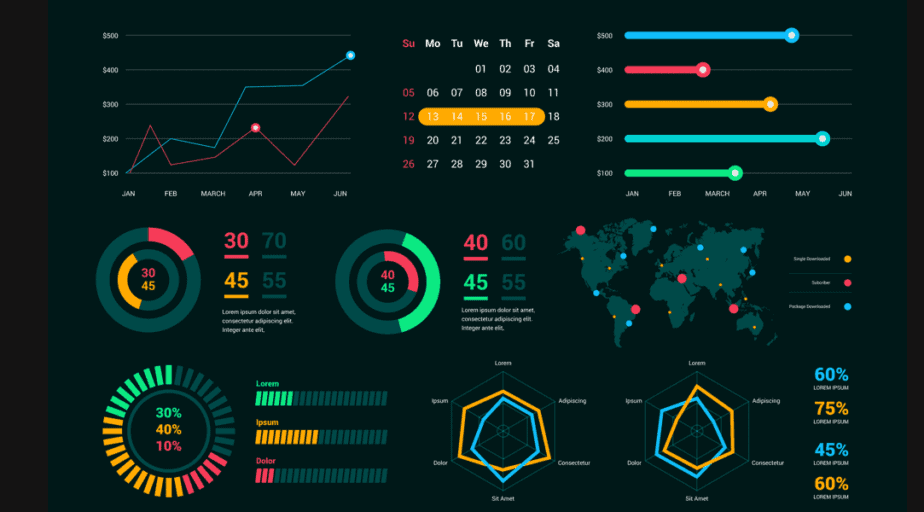
This Data Visualization full course will help you learn how to make sense of data and create interesting reports and dashboards. You will create visualizations using Tableau, Power BI, Excel, R, and Python. This video will make you understand data better and draw meaningful conclusions.
Course Content
Data Visualization Using Tableau Part 1
-
Lesson 1
00:00 -
Data Visualization Using Tableau Part 2
00:00 -
Tableau Dashboard
00:00
What is power Bi
Excel Dashbaord
GGPlot2 Tutorial
Matplotlib Tutorial
Student Ratings & Reviews

No Review Yet